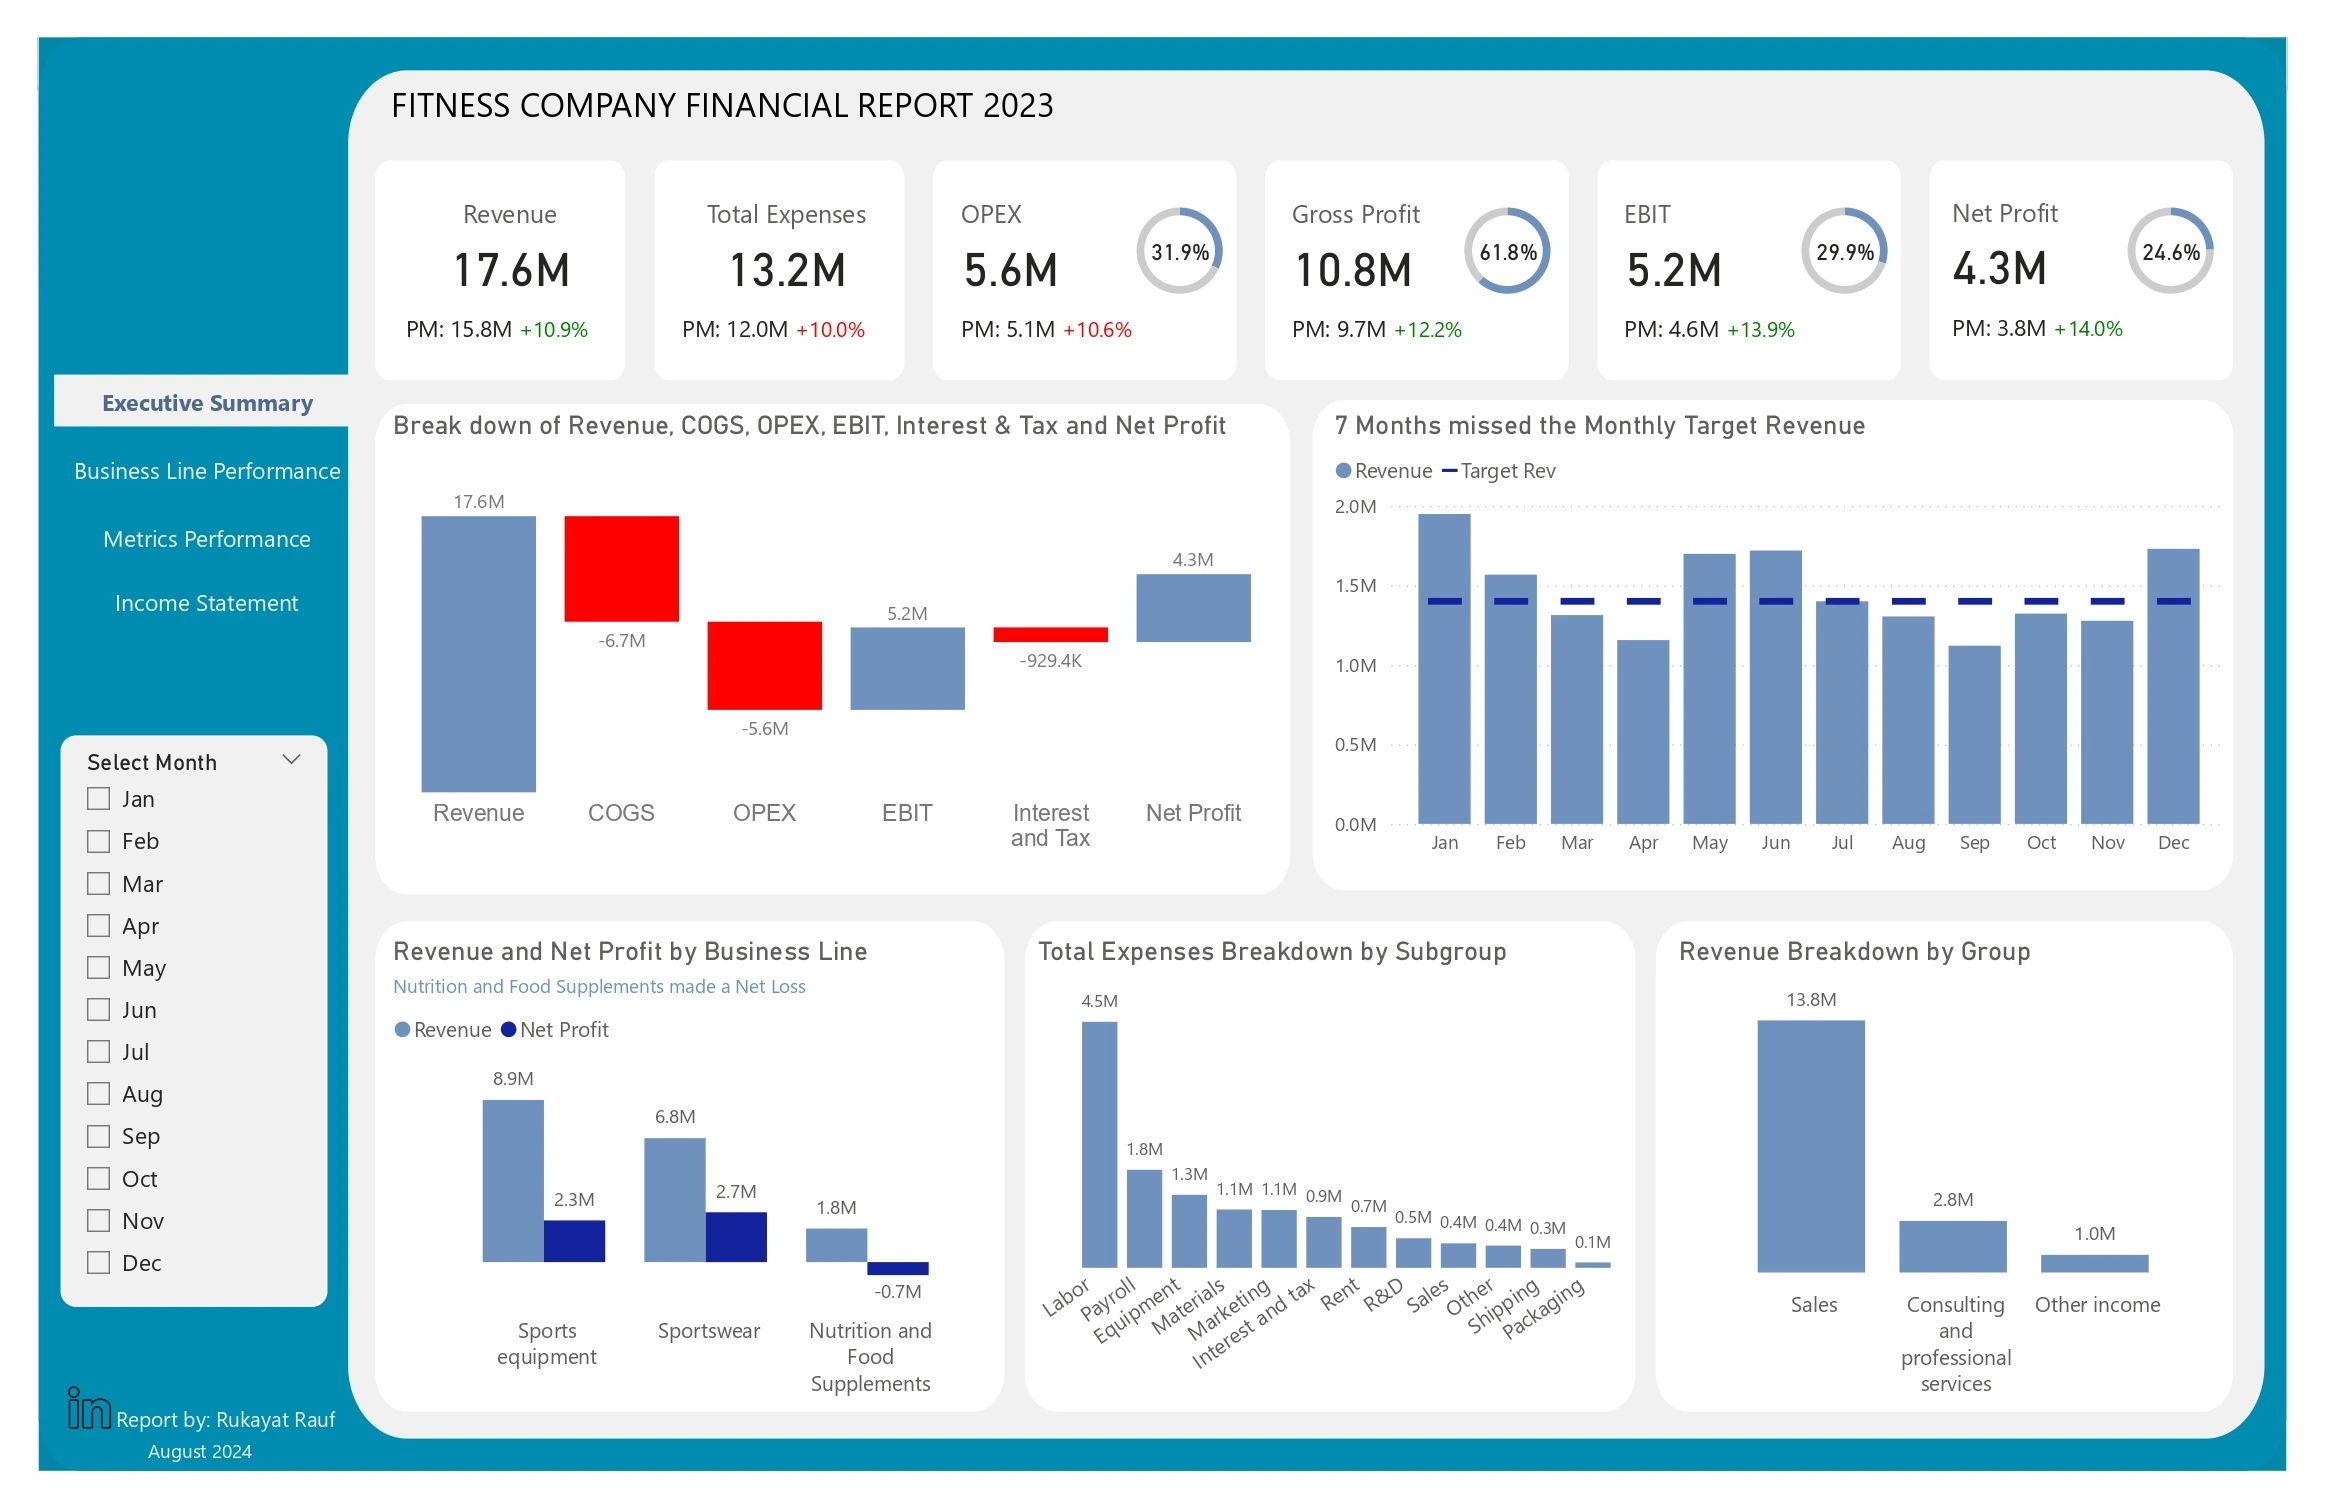
Financial Performance Analysis
Built an interactive financial dashboard to examine revenue, costs and profitability, with monthly and quarterly views for business performance monitoring.
View Case Study →
Rukayat Rauf · Data Analytics · Applied AI & Automation · Education
Combining Data Analytics with practical AI and automation across analysis, coding, insight generation and everyday workflows. Founder of Ratafar Academy.
Looking to hire a data analyst or consultant?
Business intelligence, sales and financial analytics — with practical AI and automation to improve analysis and repetitive workflows.
Built an AI enquiry workflow that classifies leads, handles replies and logs actions.
Explore AI & Automation Work →Evaluating my experience for a role?
Case studies and applied research alongside a Master's thesis in predictive analytics. The Academy and public content are the communication track record behind the resume.
Send a Hiring Enquiry →Want to build in-demand data skills that employers care about?
Ratafar Academy teaches Excel, SQL, Power BI, Python, and AI for analytics in live cohorts — practical, career-focused, grounded in real client work.
Explore Ratafar Academy →
Data doesn't improve anything
by existing.
It only matters
when it changes a decision.
Start with the problem, not the tool.
Every engagement begins with the business question — what needs to change, and what data can move it. The dashboard is the last thing designed, not the first.
Test the idea on real data.
A Master's thesis on predicting IT project delays used 18 actual project records — because theoretical models that haven't touched real-world messiness aren't useful models.
Teach the thinking, not just the tool.
Analysts who understand why a metric matters produce better dashboards than those who only know how to build them. The tool is the easy part.
Explain it out loud.
If you can't teach it clearly to someone else, you probably don't understand it well enough yourself. Publishing is a form of quality control.
A selection of projects showing how I use data to answer business questions, uncover insights and support better decisions.
Built an interactive financial dashboard to examine revenue, costs and profitability, with monthly and quarterly views for business performance monitoring.
View Case Study →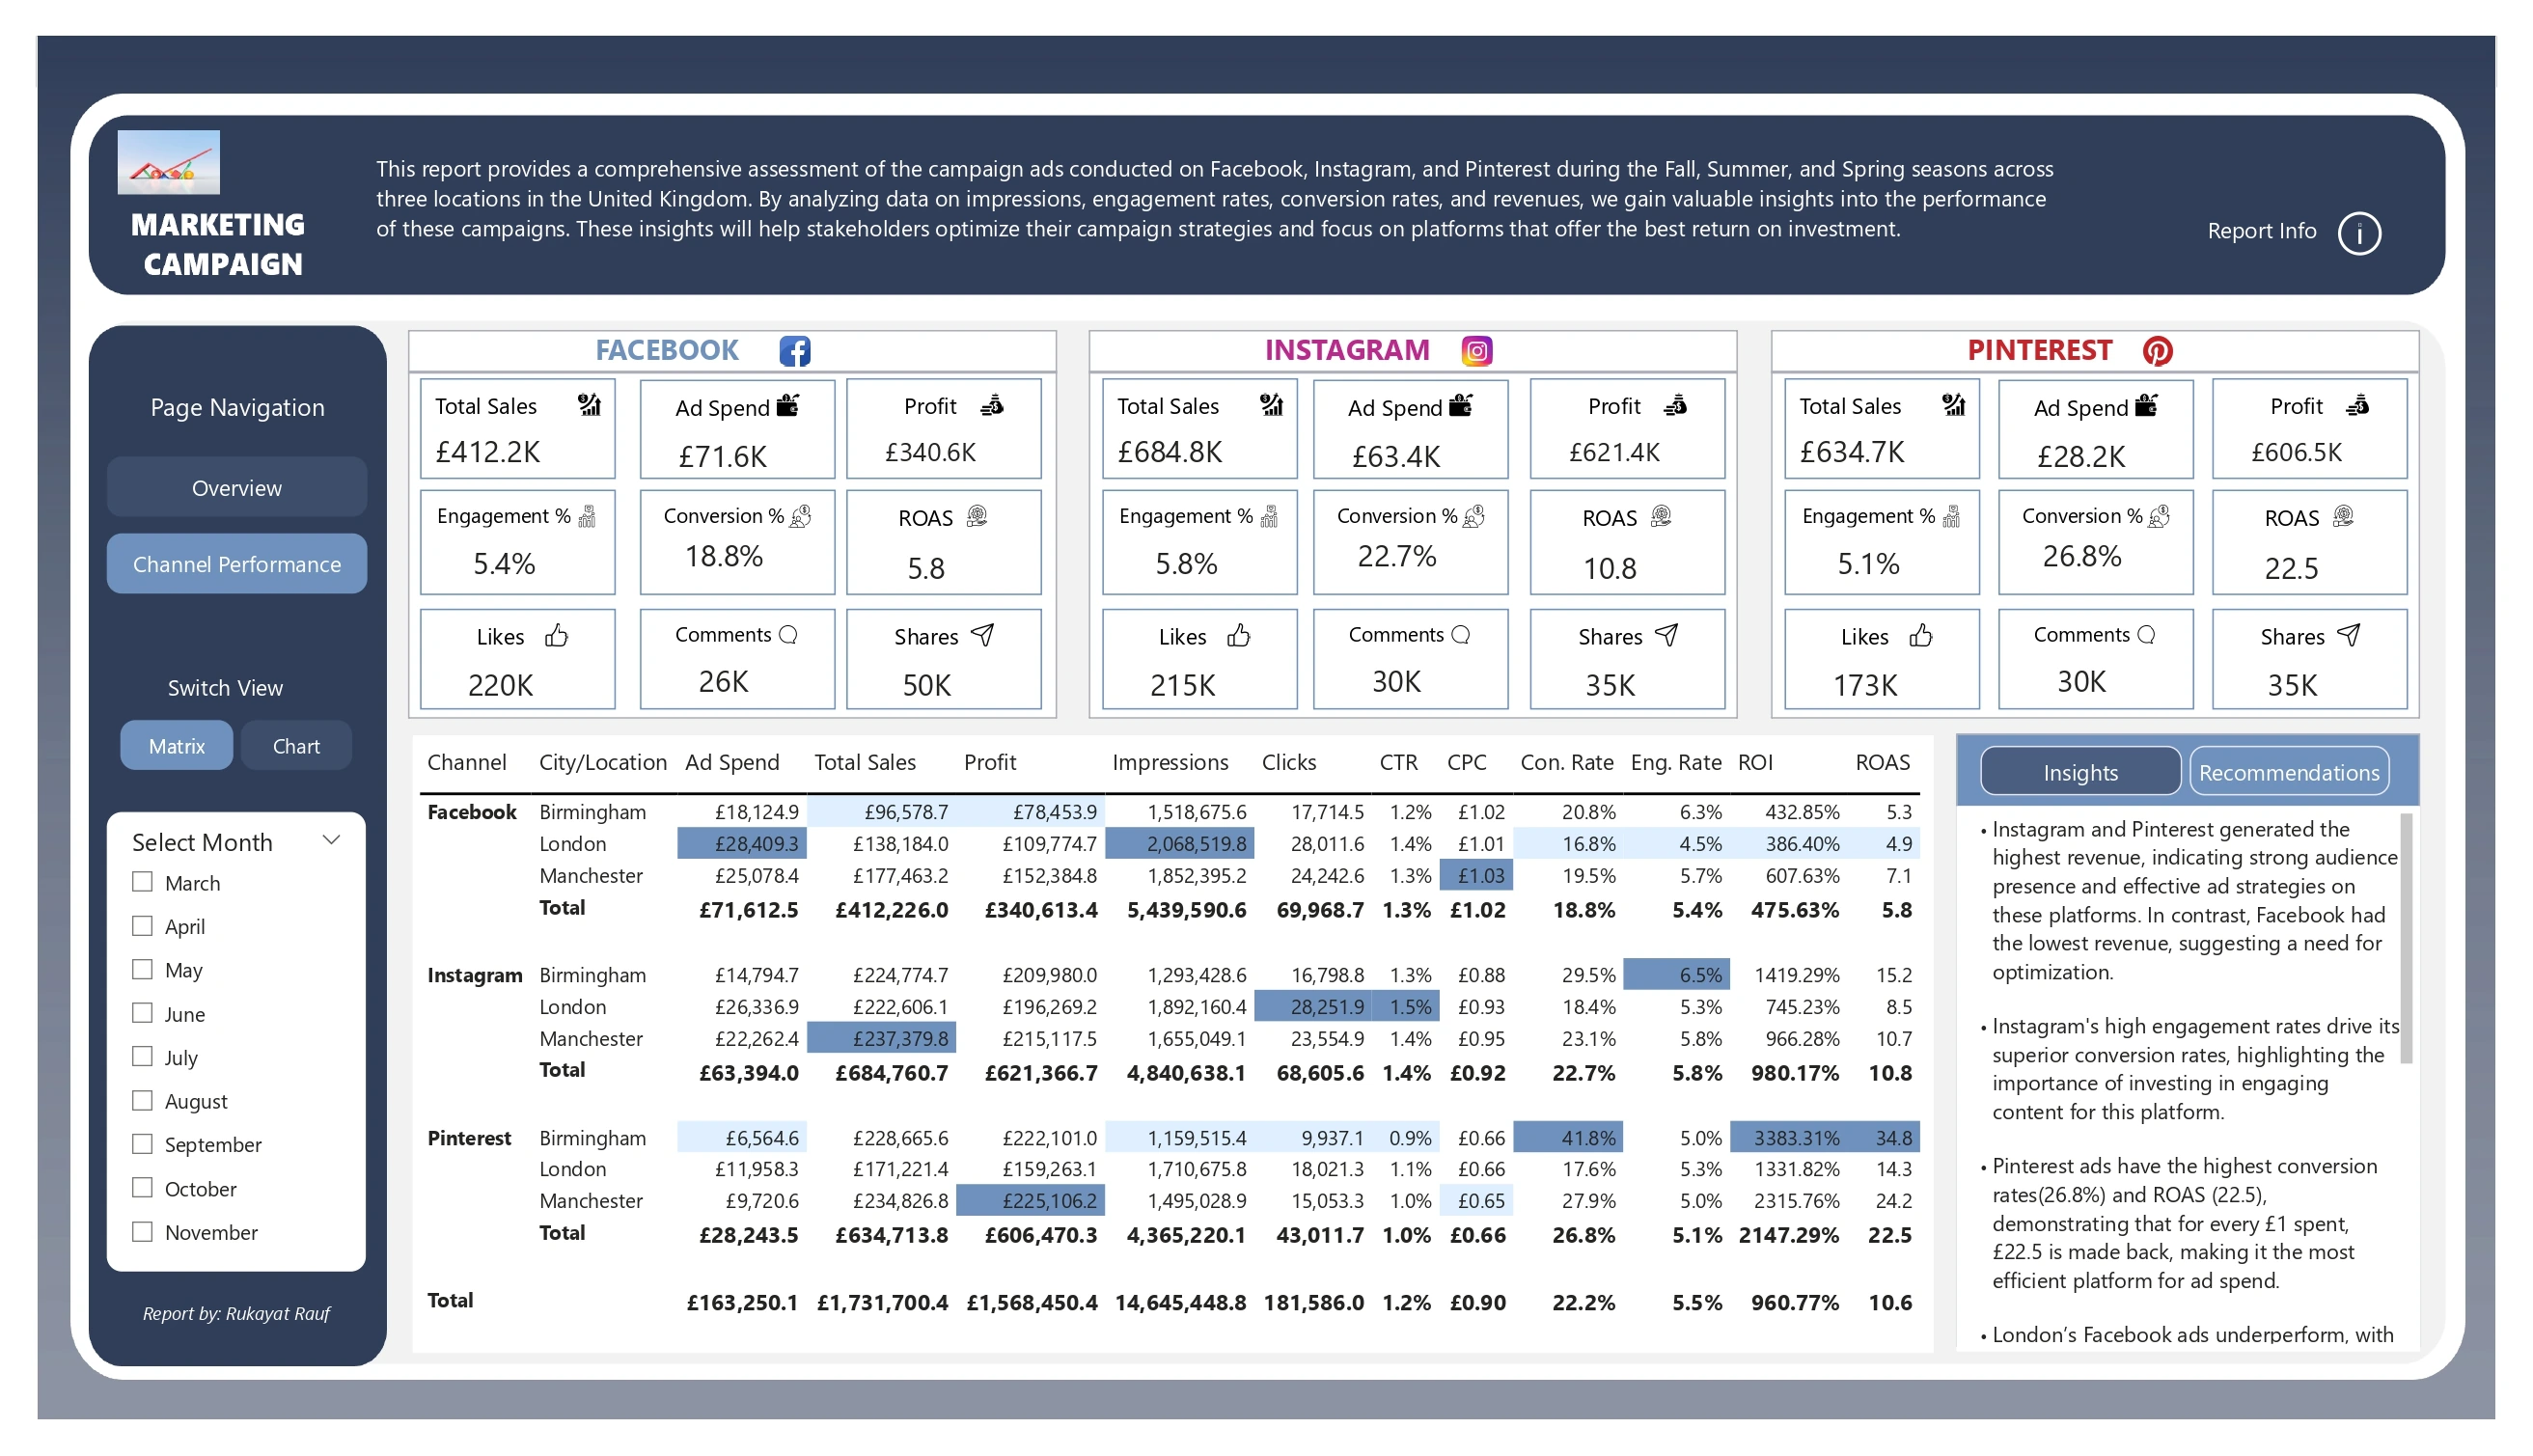
Analysed conversion, revenue and ROAS across channels and seasons to identify stronger-performing campaigns.
View Case Study →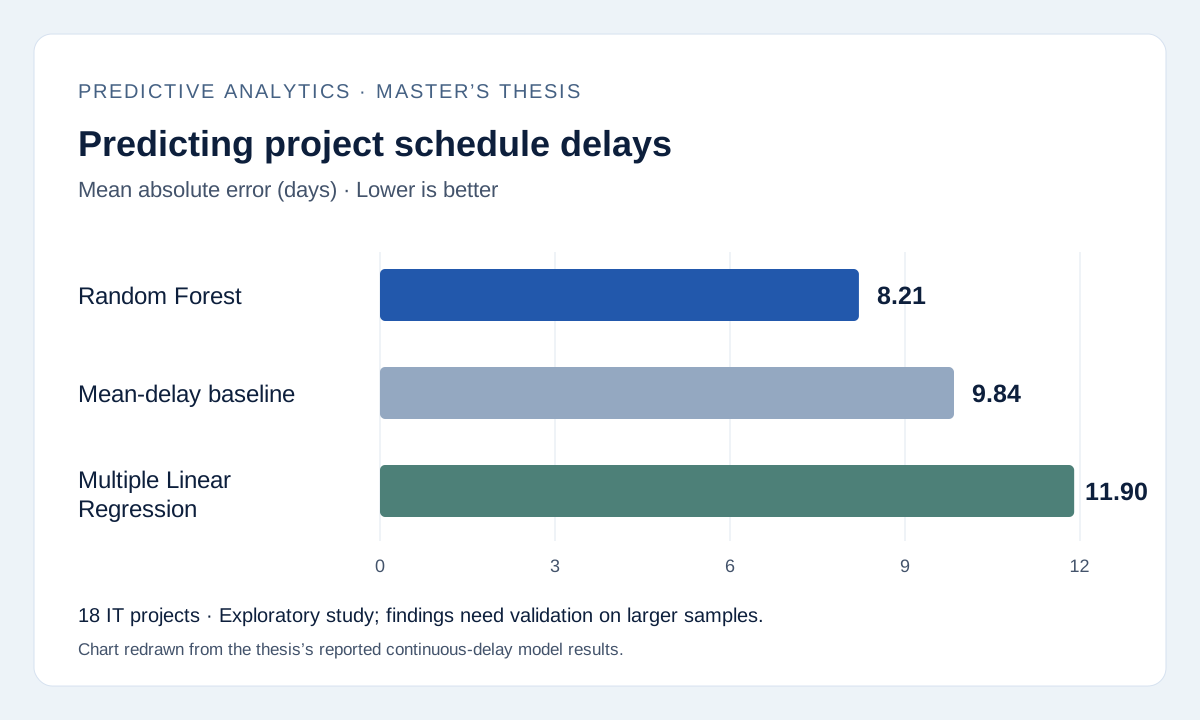
Developed predictive models using 18 historical IT projects to explore early identification of schedule delays.
View Case Study →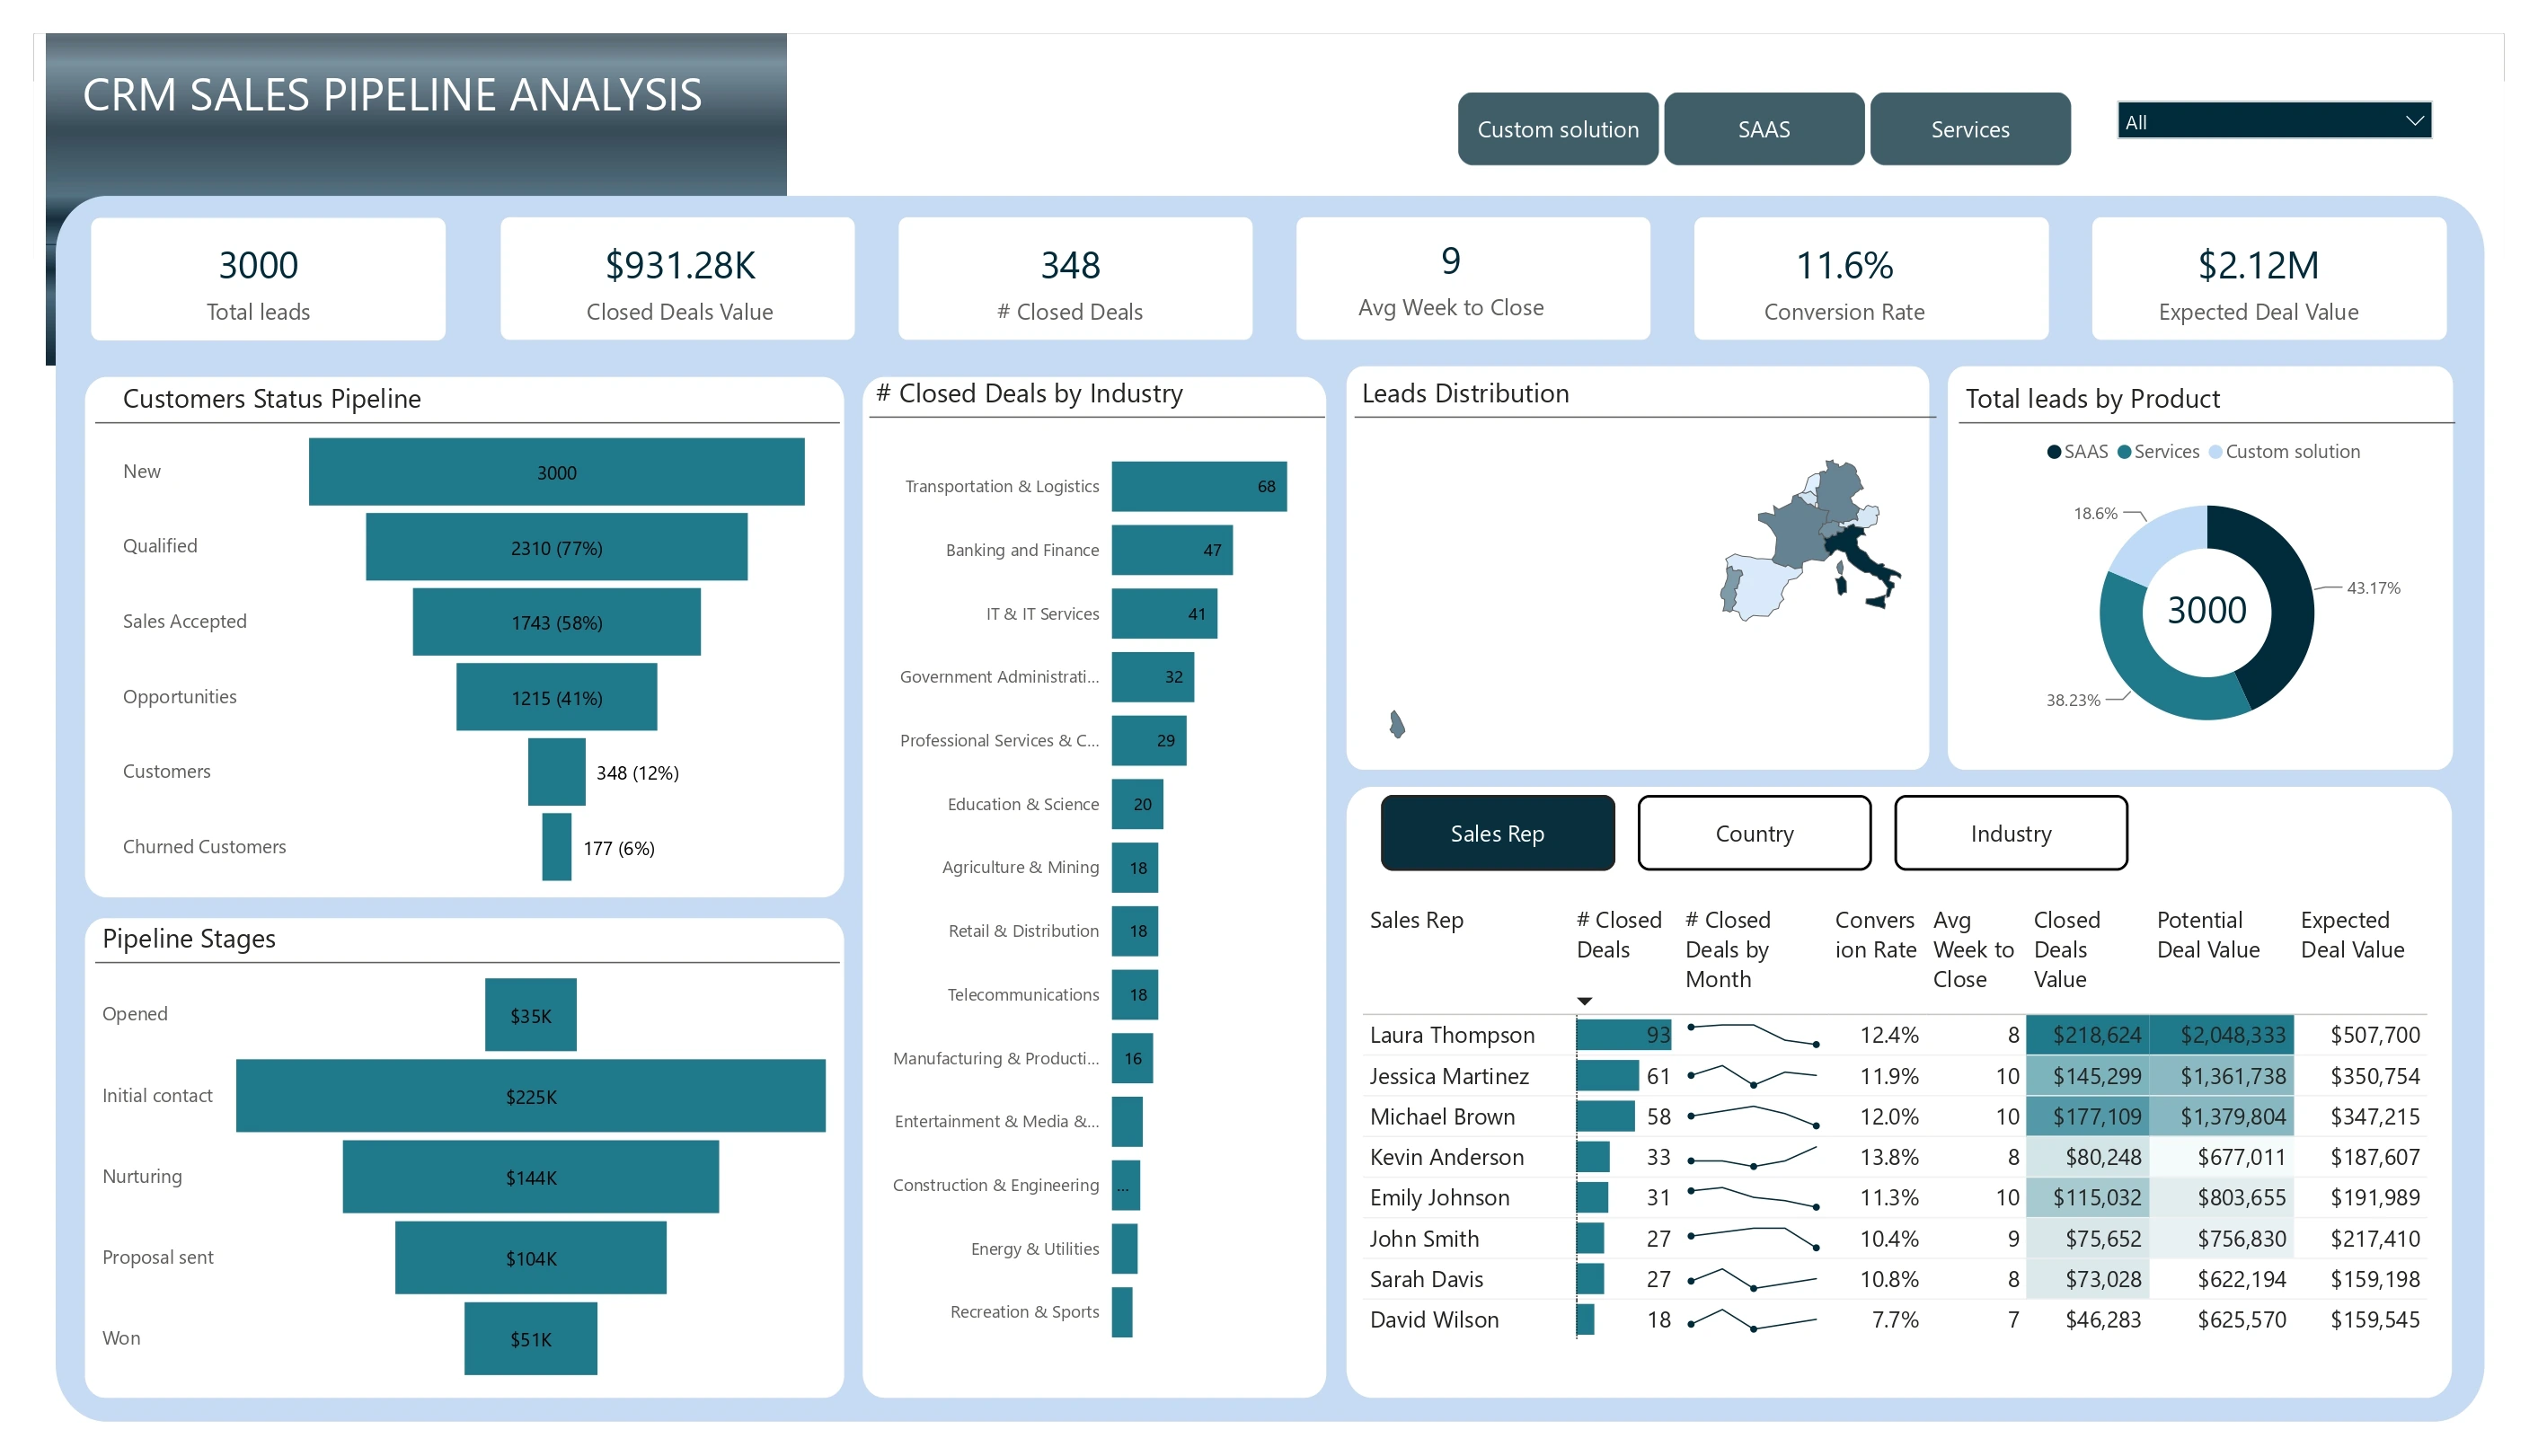
Analysed funnel stages, opportunities and conversions to make sales pipeline performance easier to assess.
View Case Study →Her expertise and attention to detail were evident throughout the project. She demonstrated exceptional skills, delivering a high-quality solution that perfectly met my needs.
Throughout the internship she carried out flawless work, always being punctual in her assignments and delving deep into the subject matter. Whenever difficulties arose, she always exhausted all available options before proactively suggesting a correctly revised course of action or mitigation strategies.